LeanPlot
LeanPlot turns Lean 4 code into interactive, React-powered charts that render right inside VS Code's infoview. Built on top of ProofWidgets4 and Recharts, it lets you inspect functions and data visually while you prove.
Features
- Simple plotting –
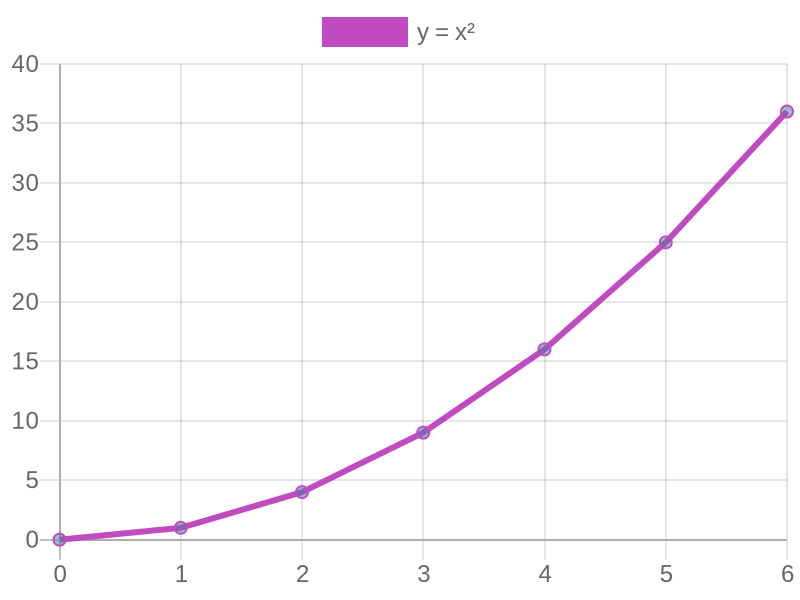
#plot (fun x => x^2)just works with automatic axis labels and styling - One-liner helpers –
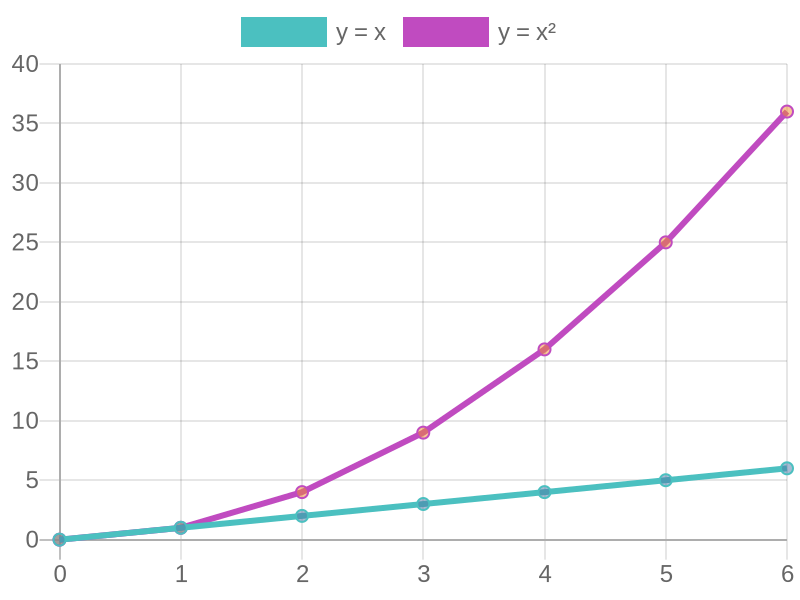
plot,plotMany,scatter,barfor beautiful plots with zero config - Composable graphics – overlay or stack plots with the
+operator - Grammar of Graphics – fluent builder pattern inspired by ggplot2
- Faceting – multiple sub-plots in a grid layout
- Log/linear scales – visualize exponential growth with logarithmic axes
- Data transformations – apply scales, normalize, and smooth data
Installation
Add LeanPlot to your project's lakefile.toml:
[[require]]
name = "LeanPlot"
git = "https://github.com/alok/LeanPlot"
Then fetch and build:
lake update
lake build
You'll need node/npm on your PATH – ProofWidgets handles the bundling automatically.
Quick Start
import LeanPlot.API
import LeanPlot.DSL

-- Simple function plot
#plot (fun x => x^2)

-- With custom sample count
#plot (fun t => Float.sin t) using 400

-- Doc comments become chart captions (a poor man's legend!)
/-- The classic parabola y = x² -/
#plot (fun x => x^2)

-- Multiple functions with automatic legend
#html plotMany #[("sin", fun x => Float.sin x), ("cos", fun x => Float.cos x)]

-- Scatter plot
#html scatter (fun x => x^2) (steps := 50)

-- Bar chart
#html bar (fun i => i^2) (steps := 10)
Hover over #plot or #html in VS Code to see the interactive charts!
PNG Export
import LeanPlot.API
import LeanPlot.Debug
open LeanPlot.API LeanPlot.Debug

#html withSavePNG (plot (fun x => x^2)) "my-plot" "quadratic.png"
Advanced Composition
import LeanPlot.Algebra
open LeanPlot.Algebra
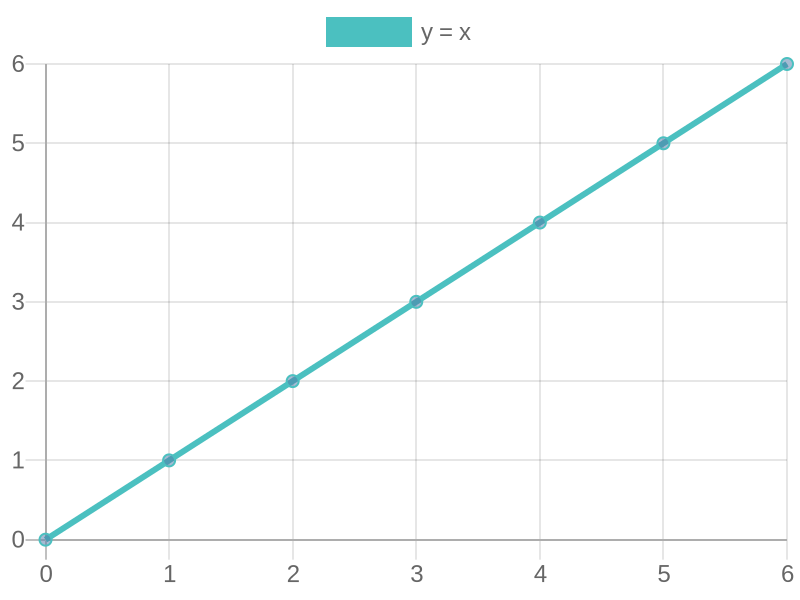
#plot (
line "y" (fun x : Float => x) +
line "y²" (fun x => x*x)
)
Grammar of Graphics
import LeanPlot.GrammarOfGraphics
import LeanPlot.Core
open LeanPlot.GrammarOfGraphics

#html (
  plot (fun x => x * x)
    |> fun p => PlotBuilder.withTitle p "Quadratic Function"
    |> fun p => PlotBuilder.withSize p 500 400
    |> PlotBuilder.build
    |> Render.render
)
Demo Gallery
LeanPlot.Demos.SmartPlottingDemo– Zero-config beautiful plots (start here!)LeanPlot.Demos.LinearDemo,QuadraticDemo,CubicDemo– Basic function plotsLeanPlot.Demos.OverlayDemo– Overlaying multiple functionsLeanPlot.Demos.TrigDemo– Trigonometric functionsLeanPlot.Demos.LogScaleDemo– Logarithmic scalesLeanPlot.Demos.GrammarDemo– Grammar of Graphics DSLLeanPlot.Demos.TransformDemo– Data transformationsLeanPlot.Demos.FacetDemo– Grid layouts
Open any demo and hover over #plot or #html to see the charts.
Documentation
Full documentation is available at https://alok.github.io/LeanPlot/
To build docs locally:
lake build leanplot-docs
.lake/build/bin/leanplot-docs
python3 -m http.server 8000 --directory _out/docs/html-multi
License
Apache License 2.0 – see LICENSE for details.