Vizagrams
![]()
Vizagrams is a visualization framework that integrates diagramming and data visualization, with the goal of providing high expressiveness with intuitive usability.
The framework implements a diagramming DSL together with a visualization grammar, thus allowing users to create diagrams by combining and transforming plots, as well as to create new visualization specifications using diagram construction operations.
For the original Julia implementation, visit:
https://github.com/davibarreira/Vizagrams.jl
This Lean implementation is still under development.
Project Structure
The Vizagrams library is organized into the following core modules:
Core Modules
-
LinearAlgebra - Mathematical foundation for 2D geometric operations. Provides vector spaces (
Vec2), affine transformations (Mat2Vec2), and geometric operations following Felix Klein's Erlanger Program. -
Geom - Geometric primitives with two representations:
Geom: Semantic representation (intuitive for users, e.g., circle defined by center and radius)CovGeom: Covariant representation (points-based, ideal for applying transformations)
-
Style - Styling primitives for geometric objects. Defines
Stylestructures with attributes like stroke/fill colors and widths, with composable styling via the++operator. -
Prim - Graphical primitives that combine geometry with style, forming the basic building blocks of diagrams.
-
Mark - Higher-level graphical marks that can be composed and transformed to create complex visualizations.
-
FreeMonad - Free monad structure (
𝕋) providing compositional semantics for graphical marks. Enables building complex diagrams through algebraic composition (+) and transformation (*) operators. -
Envelope - Envelope functions and bounding box operations for layout. Provides precise positioning, alignment, and spatial composition using directional operators (
→,←,↑,↓). -
VizBackend - Rendering backend that converts abstract diagram representations to SVG output using ProofWidgets.
-
GraphicExpression - Expression types for graphic specifications.
-
DataFrame - Data structure support for data-driven visualizations.
Documentation and Examples
Tutorials
Learn Vizagrams through hands-on tutorials in the Test/Tutorials directory:
-
Basics.lean - Introduction to drawing simple diagrams, applying transformations, composition operations, and basic layout techniques.
-
Custommarks.lean - Advanced tutorial on creating custom graphical marks by implementing the
MarkInterfacetypeclass. Includes examples like creating custom arrow marks.
Installation
To use Vizagrams in your Lean project, add it as a dependency in your lakefile.lean:
require vizagrams from git "https://github.com/arademaker/vizagrams"
Usage Guide
Basic Concepts
Vizagrams uses a compositional approach to building diagrams:
- Marks - The basic graphical elements (circles, rectangles, polygons, etc.)
- Transformations - Geometric (
ℍ) and style transformations applied with* - Composition - Combining marks with
+ - Layout - Positioning marks with directional operators (
→,←,↑,↓)
Quick Start
1. Creating Basic Shapes
Start by importing the necessary modules and creating simple shapes:
|
|
2. Applying Transformations
Use the * operator to apply geometric and style transformations:
|
|
3. Composing Diagrams
Combine multiple marks using the + operator:
|
|
4. Layout with Directional Operators
Use envelope-based positioning for precise layout:
|
|
5. Example: Nested Composition
|
|
Key Operators
+- Compose marks (overlay)*- Apply transformation to mark→[gap]- Position right with gap←[gap]- Position left with gap↑[gap]- Position above with gap↓[gap]- Position below with gap
Common Transformations
#check rotate (π/4)           -- Rotate 45 degrees
#check scale 2                -- Uniform scaling by factor 2
#check translate ![1, 2]      -- Translate by vector
#check ℍ.mk {} (rotate (π/4))        -- Combined style and geometric transformation
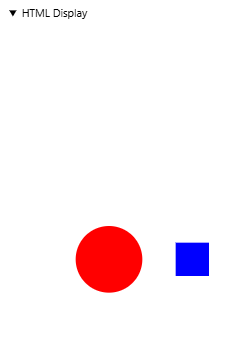
Examples
Examples are in develop, now we just have an example of a chess game